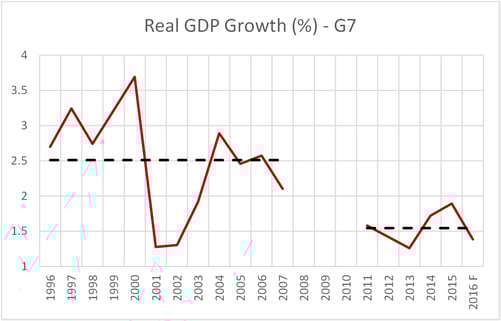
Update Bennett Jones Fall 2016 Economic OutlookDavid A. Dodge O.C., Richard Dion, John M. Weekes and Michael Horgan November 29, 2016 Authors Richard DionSenior Business Advisor Replay the Economic Outlook seminar presented at the Bennett Jones office on November 29. This Fall Outlook has four sections. The first section describes the main aspects of the "new normal" of low growth that has prevailed for advanced economies in the last six years of economic recovery. The second section discusses key factors that have shaped the economic performance of advanced economies and are likely to condition growth in aggregate demand and potential output over the next several years. With this analysis in background, the third section briefly explains our short term outlook for the global economy and Canada to 2018, showing that for the advanced economy it remains well on the low-growth path of the "new normal". Finally, a fourth section draws implications of the "new normal" for the conduct of economic policies in advanced economies and the strategy businesses should follow. Section I: The New Normal – Low Growth: 2011-2016The world as a whole, and notably the advanced economies (AE), have experienced subdued growth after 2010, much below the trends experienced before the 2008 crisis (Chart 1.1). There seems to have been a structural break, which the usually protracted effects of debt reduction which follow a financial crisis can explain only in part. Chart 1.1:
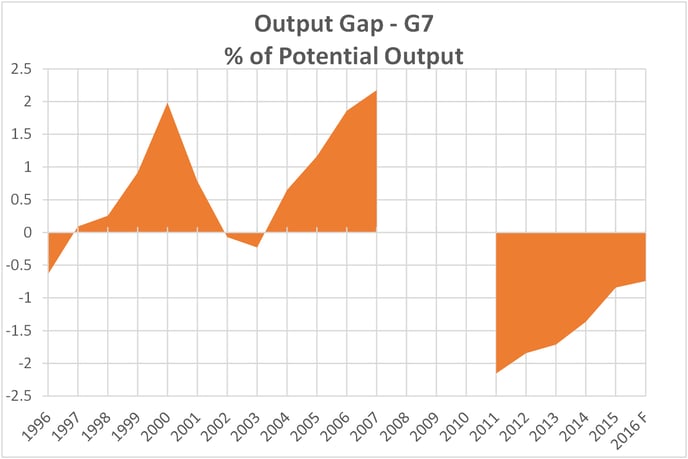
Source: IMF, World Economic Outlook, October 2016 database. This low growth for advanced economies reflects both inadequate demand growth and a decline in potential output growth. It was accompanied by subdued core inflation and persistently low actual and expected interest rates. Inadequate demand growth showed up in a considerable, persistent shortfall of actual aggregate demand relative to potential output (Chart 1.2). Chart 1.2:
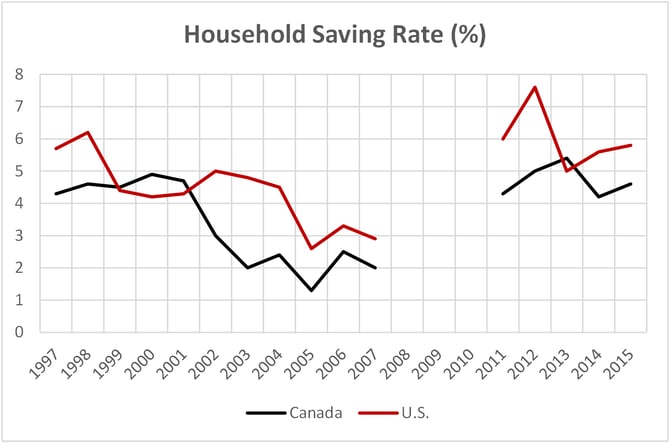
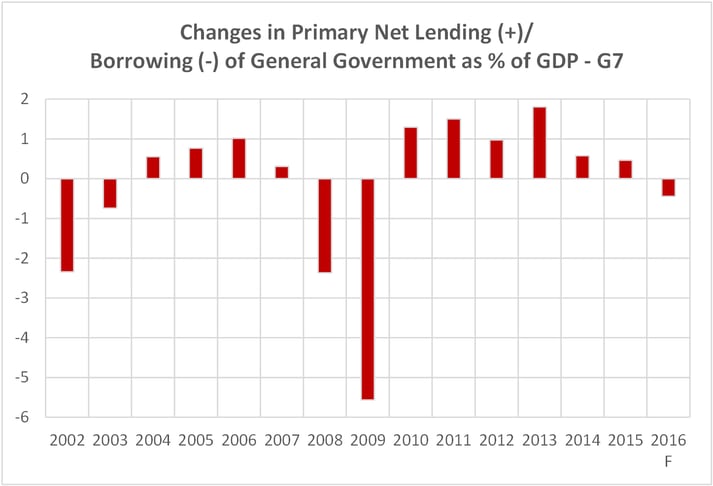
Source: IMF, World Economic Outlook, October 2016 database. Demand in advanced economies was held back by several factors, whose relative importance varies from country to country. In both Canada and the United States the lower growth in aggregate demand over 2011-2015 relative to 1996-2007 primarily comes from household consumption, then from government consumption and investment, and then from nonresidential fixed business investment. Households adjusted to the recession by sharply raising their saving rate and subsequently keeping them at these higher levels in order to reduce their debt and as a precaution in the face of uncertainty (Chart 1.3). Chart 1.3: Sources: Statistics Canada Cansim 380-0072 and U.S. Bureau of Economic Analysis. Governments also increased their saving rate as fiscal consolidation followed a major stimulus in 2008-2009 and resulted in a drag on growth until 2015 (Chart 1.4). Chart 1.4:
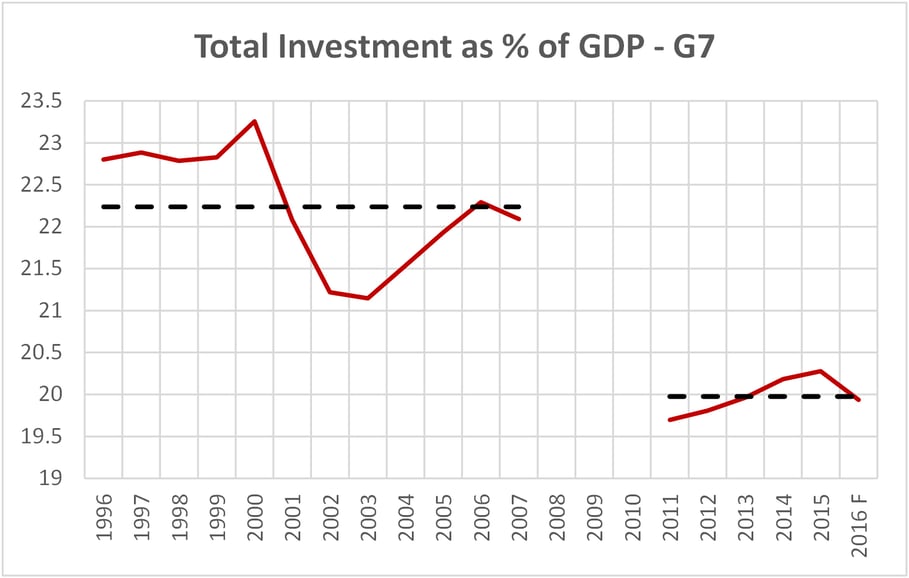
Source: IMF, World Economic Outlook, October 2016 database. Inadequate demand also reflects a lower investment rate due to several factors, including weaker growth and pessimistic outlook regarding future demand, housing market correction in a number of countries, and a collapse of capital spending in the oil and gas sector starting in 2015. (Chart 1.5). Chart 1.5:
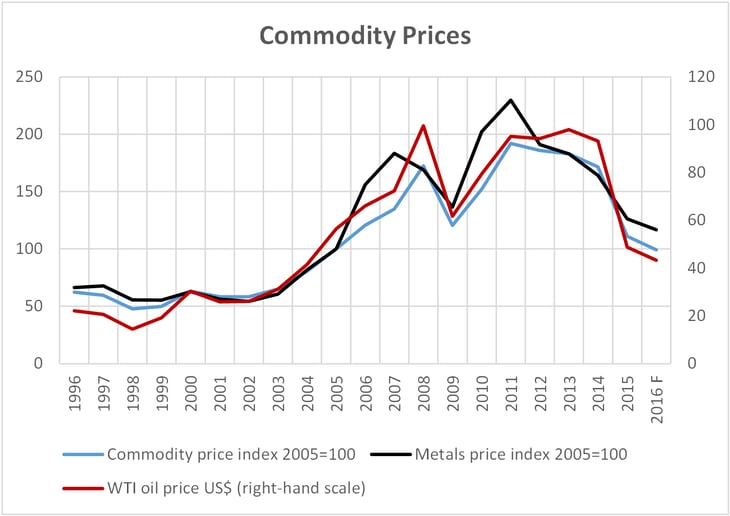
Source: IMF, World Economic Outlook, October 2016 database. A lower contribution of real nonresidential business fixed investment to real GDP growth not only slowed productivity growth but also contributed to depress gains in international trade intensity1 as the machinery and equipment component of investment has a particularly high import content (Chart 1.6). Chart 1.6: Source: IMF, World Economic Outlook, October 2016 database. Calculations by the authors. The slowing of growth in advanced economies partly resulted from the negative spillovers of a deceleration of growth in China since 2011, which combined with a shift away from high-import components of final demand and production, compressed Chinese imports from the rest of the world (Chart 1.7).2 The slowdown in China was indigenous for the most part, reflecting rebalancing toward a more sustainable growth model, and some tightening of fiscal policy and credit conditions at times. Chart 1.7: Source: IMF, World Economic Outlook, October 2016 database. The slowdown in and change in composition of Chinese growth, and more generally the slowing in world growth, combined with increased supply in response to high prices, led to a fall in commodity prices from their 2011 peak (Chart 1.8). In real terms, commodity prices in 2016 are at about the same levels as at mid-2000s. These more sustainable levels result from the termination of the commodity supercycle that lasted from 2004 to 2014 rather than from the structural break in the growth rate of advanced economies that started showing up in 2011.3 Chart 1.8:
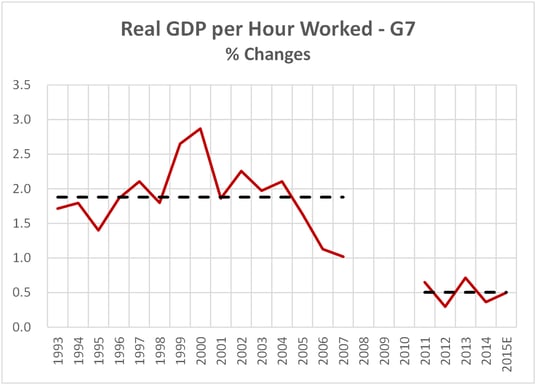
Source: IMF, World Economic Outlook, October 2016 database. Accompanying subdued growth of demand in advanced economies was a decline in potential output growth due to adverse demographics and lower trend labour productivity growth (Chart 1.9). Population aging per se would have cut growth in trend aggregate labour force participation and hours worked by 0.4-0.5 percentage points per year over 2011-2016. Lower productivity growth, on the other hand, would have been partly a consequence of persistent weak growth of demand, which discouraged business investment. Chart 1.9:
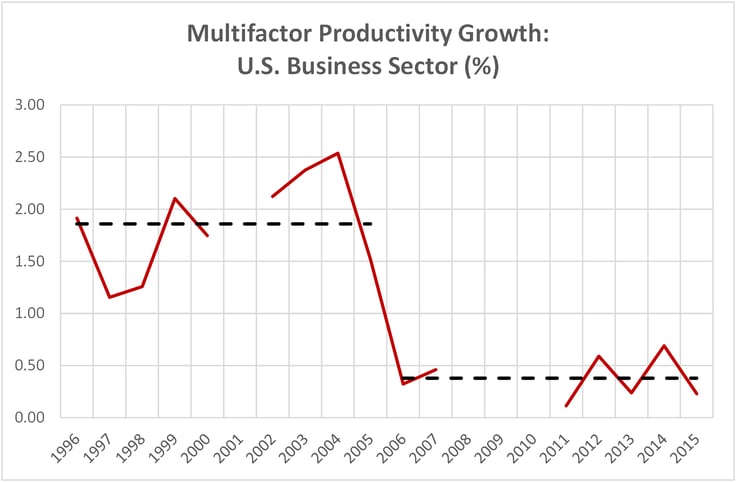
Source: CD database. Estimate for 2015 from the authors. The fall in trend labour productivity growth also reflected a fall in trend multifactor productivity (MFP) growth. In the U.S., trend MFP growth was unusually high in 1996-2005 as business models and logistics more fully captured the benefits of ICT and Internet (Chart 1.10). Trend productivity growth petered out in 2006, well before the onset of the financial crisis, and has since remained in the doldrums. Chart 1.10:
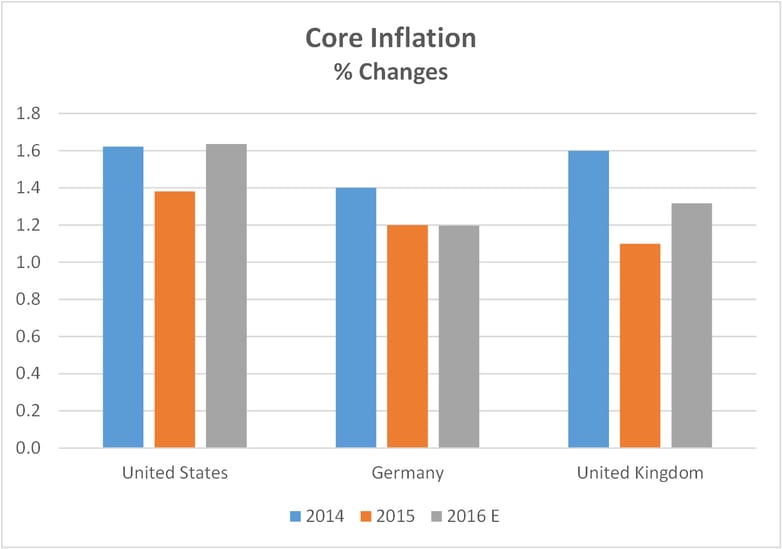
Source: U.S. Bureau of Labor Statistics. Even after several years into the recovery, core inflation has remained subdued as a result of domestic and global excess supply and moderate growth in wage costs (Chart 1.11). Chart 1.11:
Sources: CD database and U.S. Bureau of Economic Analysis. Core inflation: U.S.: PCE excluding food and energy; Germany and U.K.: CPI excluding food and energy. 2016 figures: U.S.: average of January to September; Germany and U.K.: average of second and third quarters. Slack in the labour and product markets and low core inflation prompted monetary authorities to keep policy interest rates near zero and, in a few important cases, to engage in a massive expansion of their balance sheets through quantitative easing (Chart 1.12). The lower effectiveness of monetary policy once policy interest rates were reduced to near zero, as they were by 2009, pervasive uncertainty about future prospects, which made households and businesses more cautious in taking advantage of low interest rates, high household debt levels to start with, and in some cases credit constraints help explain why demand has remained inadequate and inflation low in spite of exceptionally accommodative monetary policies. Chart 1.12: Source: IMF, International Financial Statistics. Financial investors' focus on the risk of prolonged lower-than-expected inflation in a context of low growth has contributed to expectations of low short-term rates for a long time and hence persistently low long-term interest rates and a flattening of the yield curve since early 2011 (Chart 1.13). Chart 1.13: Source: Board of Governors of the Federal Reserve System.
Summary 2011-2016
To conclude this section, it is clear that structural developments have been less favorable to growth in the advanced economies in the last six years than in the decade that preceded the financial crisis. These structural developments, whose intensity varies from country to country, relate to lower trend productivity growth (Chart 1.9), higher saving rates by households (Chart 1.3) and governments (Chart 1.4), lower business investment rates (Chart 1.5), and lower trade intensity (Chart 1.6). In addition, as will be discussed below, demographics have become more unfavourable to growth (Chart 2.1).
| ||||||||||||||||||||||||||||||||||||||||||||||||||||||||||||||||||||||||||||||||||||||||||||||||||||||||||||||||||


| Evolution relative to 1996-2007 |
||
| 2011-2016 relative to 1996-2007 |
2017-2020 relative to 2011-2016 |
|
| Demographics |
||
| Labour force growth |
lower | slightly lower |
| Household saving rate |
higher | slightly higher |
| Income distribution |
||
| Labour share of income |
lower | stable to lower |
| Inequality of household income |
greater | greater |
| Investment | ||
| Investment share of GDP |
lower | uncertain |
| Incentives for buyback/dividends, M&A |
greater | uncertain |
| International trade intensity |
much lower |
lower |
| Productivity | ||
| Innovation | lower | uncertain |
| Growth ICT, software and R&D investment |
lower | uncertain |
| Firm creation rate |
lower | uncertain |
| Trend growth in China |
lower |
lower |
Apart from demographics, the medium term evolution of key elements of the new normal for advanced economies, including uncertainty itself, remains far from clear but nonetheless could well lead to persistent low growth. In the short term at least, there appears to be agreement that growth in advanced economies will remain subdued generally—a continuation of the "new normal".
Section III: Global Growth Outlook 2016 – 2018
Against the background of the preceding analysis, we project a "low for long" scenario with the global economy growing on average at about three percent per year from 2016 to 2018, as in the Spring 2016 Outlook (Table 3.1). While recovering in part from a marked softening in 2016, growth in advanced economies remain on the low-growth path of the "new normal" in 2017 and 2018. Growth for emerging economies, on the other hand, strengthens slightly in 2016 before gradually losing ground in the next two years. This is the result of a cyclical recovery from the slowdown of 2014-15 in many emerging economies, which gets blunted in 2017 and 2018 by the direct and indirect effects of a pronounced slowing of growth in China.
Table 3.1:
Short-term Prospects for Output Growth (%)*
| Share (%) | 2015 | 2016 | 2017 | 2018 | |
| Canada | 1.5 | 1.1 | 1.2 (1.4) |
2.0 (2.4) |
2.0 (1.9) |
| United States | 16.4 | 2.6 | 1.5 (1.9) |
2.3 (2.3) |
2.3 (2.1) |
| Euro area | 12.3 | 2 | 1.5 (1.6) |
1.5 (1.6) |
1.5 (1.5) |
| Japan | 4.6 | 0.5 | 0.6 (0.8) |
0.6 (0.7) |
0.5 (0.6) |
| China | 17 | 6.9 | 6.6 (6.1) |
5.7 (5.2) |
5.2 (4.8) |
| Rest of World | 48.2 | 2.7 | 2.9 (2.9) |
3.2 (3.2) |
3.2 (3.2) |
| World | 100 | 3.2 |
3.0 (3.0) |
3.1 (3.1) |
3.0 (2.9) |
*Figures in brackets are from the Bennett Jones Spring 2016 Economic Outlook.
- This scenario incorporates no major specific shock from political or trade developments. This is a big assumption in view of the current multiple risks, arising notably from the results of the U.S. election. Most likely, however, the environment will be less trade friendly.
- Interest rates are expected to remain low, with only a gradual rise in 2017; U.S. rates would rise further in 2018 if U.S. fiscal policy becomes as expansionary as Mr. Trump has promised. In any event, the total rise in U.S. policy rate should be limited by historical standards, reflecting a much lower neutral interest rate than in the past.18
- WTI oil prices are expected to trend upwards until they reach about US$60 in 2018. They are likely to show volatility around this trend.
U.S. growth finally picked up well beyond its potential rate in the third quarter of 2016 (2.9 percent) as inventory investment and net exports rebounded after several quarters of negative or very weak contributions to growth. Growth should average only 1.5 percent for 2016 as a whole, but rise to over 2 percent over the next two years.
The extent to which U.S. growth over the next two years exceeds its medium term potential (estimated at 1.8-1.9 percent) depends in part on the magnitude of Mr. Trump's promised tax cuts and spending on infrastructure. At this point our best guess is that these fiscal actions would start in the second half of 2017 and might cumulate over time to more than one percent of GDP. Should this be the case, this stimulus would raise real GDP growth by 0.1 to 0.2 percentage points in 2017 and 0.3 to 0.5 points in 2018 so that GDP growth over those two years should average about 2.3 percent. Growth in business non-residential investment should pick up in response to stronger aggregate demand growth and an economy at capacity while net export gains are likely to be restrained by additional upward pressure on the exchange rate of the U.S. dollar and stronger domestic demand.
With an economy roughly at capacity to start with, the projected above-potential GDP growth rate would be expected to generate some inflationary pressure and the Federal Reserve would be expected to react by raising its policy interest rate in both 2017 and 2018. By the end of 2018, the policy interest rate would likely have risen to close to 2.5 percent in nominal terms. The rise in U.S. rates would likely widen the interest rate differentials in favour of U.S. dollar assets and put upward pressure on the U.S. dollar.
The rebalancing of economic policies in the U.S. would have spillover effects on the rest of the world, including Canada, through trade and financial linkages. Section IV discusses the advantages of a rebalancing of economic policies for advanced economies.
In Canada growth in 2016 is turning out to be very weak for a second year in a row as a result of low U.S. growth in the first half of the year, continued difficult adjustment to the earlier fall in commodity prices and collateral decline in real income, tough competition in export markets, further retrenchment in inventory investment, and wildfires in the Fort McMurray area in the second quarter.19
Looking ahead, growth is expected to pick up from slightly above one percent in 2016 to close to two percent in 2017 and 2018. In view of the current considerable slack in the economy, this somewhat faster-than-potential pace would not put pressure on core inflation beyond the two-percent target over the next two years and therefore would leave little room for policy rate increases. The resultant widening interest-rate differential in favour of the U.S. would exert downward pressure on the Canadian dollar, offsetting an upward pressure on the currency arising from the projected increase in international oil prices. The exchange rate could thus fluctuate considerably during certain periods as expectations adjust to new information. For planning purposes, we expect the Canadian dollar exchange rate to move within a range of 71-77 U.S. cents over the projection period.
As in the spring, we believe that several factors would support stronger Canadian growth in the next two years. Total business non-residential investment, which has been depressed by the retrenchment in the oil and gas sector in the last two years, should resume growth in 2017 as the economic expansion gathers momentum and investment in the oil and gas sector stabilizes or edges up. Likewise the drag on final domestic demand exerted by the loss of real income associated with the earlier fall in the prices of oil and other commodities should diminish, thereby boosting growth relative to 2016. Firmer growth in the U.S., including in import-intensive U.S. investment in machinery and equipment, should also support a faster Canadian expansion via stronger export demand. Finally, stimulative fiscal measures by the federal government, mainly in the form of increased infrastructure investment and larger transfers to households (Canada Child Benefit), would boost growth in 2017 relative to 2016. These measures would continue to support the level of activity in 2018 but are unlikely to make a significant additional contribution to growth in that year.
For Canada the risks revolve around:
- the impact of President Trump policies on U.S. demand and interest rates;
- the evolution of oil prices;
- the impact of the federal fiscal stimulus; and
- the competitiveness of Canadian firms in export markets, notably the U.S.
An additional risk regarding Canadian exports relates to the potential restraining effects of U.S. protectionist measures put in place by Mr. Trump's government.
To conclude, at this juncture we expect for the short term much the same scenario of subdued global expansion and strengthening growth in the U.S. and Canada as in the Spring 2016 Outlook. With a Trump administration in place, a rebalancing of economic policies in the U.S., which would have taken place at least in small measure anyway, will likely be reinforced to some degree insofar as an expansionary fiscal policy boost growth and inflation in the U.S. in the short term. This fiscal stimulus would have positive spillovers on the rest of the world, including Canada, in the short term. At the same time a more protectionist trade policy by the U.S. would certainly have negative effects on the rest of the world. While the U.S. fiscal stimulus and its positive spillovers would be over by 2018, the drag on global growth arising from the U.S. protectionist measures would continue and possibly get worse.
Section IV: Implications for Government Policies and Business Strategy
Implications for Economic Policies
Rebalancing economic policy with less reliance on monetary policy and more reliance on public investment and structural policies would help to achieve stronger demand growth in advanced economies and hence help break out of the "new normal". At the September 2016 G20 meeting, many government leaders expressed interest in such rebalancing. While the economic plan of the Trump administration in the U.S. implies a vigorous rebalancing, any rebalancing on the coordinated international basis that would be necessary to materially boost global growth remains problematic.
Monetary Policy
Central banks contribute to the stabilization of real domestic demand through the setting of their policy interest rate. Traditionally, a cut in interest rates worked to induce increased demand in the near term because businesses and consumers viewed that over time inflation would increase—hence there was an advantage to bringing forward intended expenditure and take advantage of lower borrowing costs. The reduction in rates would also have an impact on the exchange rate, inducing demand for domestic output. Since the onset of the financial crisis, a slide in policy interest rates to near zero supplemented by a heavy dose of unconventional monetary policy in a number of advanced countries provided support to aggregate demand and boosted asset prices.
The efficacy of monetary policy to stimulate demand appears to be lower now than it used to be. First, the limited success of the extraordinary efforts of central banks to lift aggregate demand growth beyond mediocre rates after 2010 have led to expectations that interest rates will be "low for long" and to a flattening of the yield curve, thereby providing less incentive to pull forward more consumption and investment. Second, with household debt/disposable income ratio at an all-time high in Canada, and approaching that again in the U.S. and many other economies (including EMs), households are reluctant to incur more debt even though the ratio of current debt service costs to disposable income is low, indeed at an all-time low in Canada (6.4 percent vs 11 percent in 1990).20 Third, "radical uncertainty", to use a Mervyn King term,21 prevails and induces caution on the part of households and businesses. Finally, the efficacy of monetary policy is limited by the effective lower bound on nominal interest rates. The greatest danger at present is that there is no room to lower rates by the 400+ basis points needed to pull an economy out of recession before hitting the effective lower bound, should there be another dramatic collapse in demand.
Not only is there almost no practical room to use monetary policy going forward to stabilize growth in the event of a major negative demand shock, there is accumulating anecdotal evidence and increasing concern that today's ultra-low rates may actually be retarding growth (by inducing a rise in retirement saving), widening income inequality and distorting financial markets (causing uncertainty and leading to a misallocation of real resources).
Fiscal Policy
In the end it is not going to be modifications to monetary policy alone that offer the greatest chance for macro-economic policy to facilitate the escape from the current global economic stagnation. Fiscal policy has an important role to play as indeed it did in the past, not only in the severe slump of 2008-2009 but also as part of the activist Keynesian approach to stabilize the economy that prevailed in the first few decades of the post-war period. Recent statements from the IMF and the communiqué from the G20 meeting in Hangzhou indicate that many authorities now acknowledge the importance of expansionary budgets as a source of aggregate demand growth. Clearly this was recognized by the Canadian federal government in setting its 2016 Budget. But it is not just change in the size of the deficit that matters for growth; change in the composition of spending and revenues is even more important in the medium term. Thus, increasing public investment in productivity-enhancing infrastructure raises the long term growth trajectory—and hence expected real growth over the longer term.22
Globally many governments have the capacity to increase their borrowing at current interest rates provided that borrowing is used to finance productivity-enhancing physical or human infrastructure—infrastructure which will yield future cash flows to governments. The Canadian government has seized this opportunity in the spring 2016 Budget by committing in a first phase to invest $14 billion in infrastructure between 2016 and 2020. In a fall economic statement on November 1, the federal government committed to deliver an additional $81 billion between 2017 and 2027 to fund public infrastructure, this time partly through the agency of a newly established Canadian Infrastructure Bank and with a focus both on attracting private sector investment and relying at least in part on user charges to fund the operational, maintenance and financing costs of new infrastructures.23 Clearly all these infrastructure initiatives have the potential, if well executed, not only to stimulate demand in the economy over the next several years, but, more importantly still, to enhance trend productivity growth and hence potential output growth over the longer term.
Policy Mix
While demographic, technological, and structural factors clearly limit the extent to which macro-economic policies alone can promote higher growth, judicious coordination of monetary and fiscal policies can get countries closer to that limit than can disparate efforts of central banks and finance ministries in their respective domains. At the present time, both price and financial stability would be better served by somewhat higher policy interest rates—rates that would not imply a sacrifice of employment and growth if (and this is a big if) fiscal policy were more expansionary.
Macro-economic policies alone, however, will not materially lift long-term growth rates. If the advanced economies of Europe and North America are to achieve growth rates closer to those experienced in the second half of the last century, it is essential that governments focus on growth-enhancing structural policies—trade, education, health, competition, income distribution, taxation and public infrastructure investment. Competition and open international trade provide incentives for the development of new technology. But it is labour, education and income distribution policies that provide reasonable assurance that gains from trade and technological progress will be reasonably shared. Without such assurance, popular resistance to change can grind economic growth to a halt.
To conclude, a rebalancing of economic policy to place greater emphasis on government investment and structural policies and somewhat less reliance by central banks on ultra-low interest rates and long-term asset purchases (QE) would be a step towards escaping from the current stagnation of global economic growth, enhancing competition and productivity-raising investment, improving the distribution of income and wealth, and supporting the losers from technological change and globalization. Although such rebalancing is more likely than not, its implementation remains uncertain both in timing and extent. One important issue with increased reliance on fiscal policy is that it is hard to know when enough is enough and hard politically to turn the wheel in a timely fashion when and if fiscal restraint is ultimately required.
Implications for Business Strategy
In this world of slow growth and heightened uncertainty, businesses need to put an emphasis on flexibility, adaptation and technological innovation while at the same time maintaining a reserve of dry powder to meet unforeseen circumstances. Continued reinvestment of profits at a somewhat lower hurdle rate than was used a decade ago will be essential to maintaining productivity and competitive advantage over time.
Until well into 2017 there will be a good deal of political and economic uncertainty related to the Trump administration actions, Brexit, the December vote in Italy, and national elections in France and Germany. During this period, it would be wise for businesses to make plans for the future but refrain from making commitments until these uncertainties are substantially lifted.
Notes
- Gains in international trade intensity are measured by the differences between growth in world real GDP and growth in world trade volumes of goods and services. For more details on the causes of the decline in trade intensity, see the sub-section on trade developments in Section II.
- The fall in import growth exaggerates the amount of negative spillovers on the rest of the world. Some of the slower import growth reflects negative shocks originating outside China. See IMF. 2016. "Spillovers from China's Transition and from Migration", World Economic Outlook, October.
- Commodity supercycle here refers to “the rise, and fall, of many physical commodity prices (such as those of food stuffs, oil, metals…) which occurred during the first two decades of the 2000s (2000–2014), following the Great Commodities Depression of the 1980s and 1990s. The boom was largely due to the rising demand from emerging markets…, particularly China…, as well as the result of concerns over long-term supply availability…The 2000s commodities boom is comparable to the commodity supercycles which accompanied post–World War II economic expansion and the Second Industrial Revolution in the second half of the 19th century and early 20th century.” Wikipedia, 2000s Commodity Boom entry.
- The distribution of saving rate by age groups would have a hump shape with a peak at age group 55-59.
- The weak static effect stems from slow increases in the population shares of older age groups (65+) and decline in the share of the young age group (0-24) whose saving rate is practically nil.
- Intra-country income inequality has been going up mainly because income has been rising rapidly at the very high end relative to the middle income earners. Inter-country inequality has been going down because of huge increases in income overall in countries like China, India, Indonesia, etc. The overall effect has been an increase in a global class of super rich combined with a global decrease in poverty and a strong growth of a middle class (in emerging economies). See Milanovic, B. 2016. Global Inequality: A New Approach for the Age of Globalization, Harvard University Press.
- Capital deepening refers to an increase in capital input per labour input. With a slower growth in labour input, the same capital deepening would be achieved with a slower growth in capital input, hence lower investment. Besides uncertainty, demographics could lead to a lower investment rate than otherwise as the projected slower growth in hours worked would require a lower investment rate to accommodate the same pace of capital deepening as before. If the lower supply of hours leads to upward pressure on wages, however, desired capital deepening may actually rise faster than before and this would help support the investment rate.
- The potential conflict between capital deepening and job creation seems part of the political dynamic trade-off that appears to be taking place.
- Gordon, R. 2016. The Rise and Fall of American Growth. Princeton University Press, Table 18.3.
- See "The rise of the superstars", The Economist, September 17-23, 2016, and Council of Economic Advisers. 2016. “Benefits of Competition and Indicators of Market Power”, Council of Economic Advisers Brief, April.
- For evidence on firm size effects, see Baldwin, J.R., D. Leung and L. Rispoli. 2013. "Canadian Labour Productivity Differences Across Firm Size Classes, 2002-2008." Statistics Canada, The Canadian Productivity Review, April.
- However, small firms tend to have a lower productivity level than large ones. A rise in the proportion of large firms would thus raise the average level of aggregate productivity as a result. The net effect on aggregate productivity growth of slower average growth of productivity at the firm level and rising aggregate level of productivity as concentration increases is an empirical issue.
- This argument must not be pushed too far. Empirical support was found for the prediction that the threat of firm entry spurs innovation in sectors close to the technological frontier whereas it discourages innovation in laggard sectors because it reduces the incumbents' expected rents from innovating. See Aghion, P., R. Blundell, R. Griffith, P. Howitt and S. Prantl. 2006. "The Effects of Entry on Incumbent Innovation and Productivity". NBER Working Paper No. 12027.
- IMF (2016), p. 174.
- "Cardiac Arrest or Dizzy Spell: Why is World Trade so Weak and What Can Policy Do About It?", CD Economic Policy Paper. September 2016 No. 18.
- "Trade restrictions among G20 remain high, despite slight slowdown in new measures", World Trade Organization, November 10, 2016.
- World Economic Outlook (WEO) Subdued Demand: Symptoms and Remedies, October 2016
- The neutral interest rate is the policy rate consistent with the economy operating at capacity and inflation remaining on target. Given a lower neutral rate at present, actual policy rates need not rise as high as before to eliminate excess demand in the economy.
- Oil sands production returned to normal by the third quarter so that the temporary wildfire-related fall in oil sands production would have had only a small effect on Canadian GDP growth for 2016 as a whole.
- Statistics Canada Cansim 380-0073.
- King, M. 2016. The End of Alchemy: Money, Banking and the Future of the Global Economy. Norton.
- Public infrastructure covers a wide range of assets. Some would enhance population welfare but have dubious value when it comes to long-run enhancement of productivity. Thus the mix of infrastructure investment, and not just the amount, matters for long-term growth.
- See Dodge, D. and J. Bird. 2016. "Minister of Finance Commits to Establish a Canadian Infrastructure Bank", November 1 and Dodge, D. 2016. "Canada's Infrastructure Bank Done Right", November 3.
For permission to republish this or any other publication, contact Erica Wirthlin at wirthline@bennettjones.com.
This publication provides an overview of legal trends and updates for informational purposes only. For personalized legal advice, please contact the authors.